


In light of recent announcements that many students may not go back to school before September (if then), the Children’s Commissioner’s Office has undertaken some preliminary research on the homeschooling provided to children during lockdown. Understanding which children are missing out and why will be crucial for targeting help over the summer, in September and in the coming years as we help those disadvantaged by the pandemic to catch up.
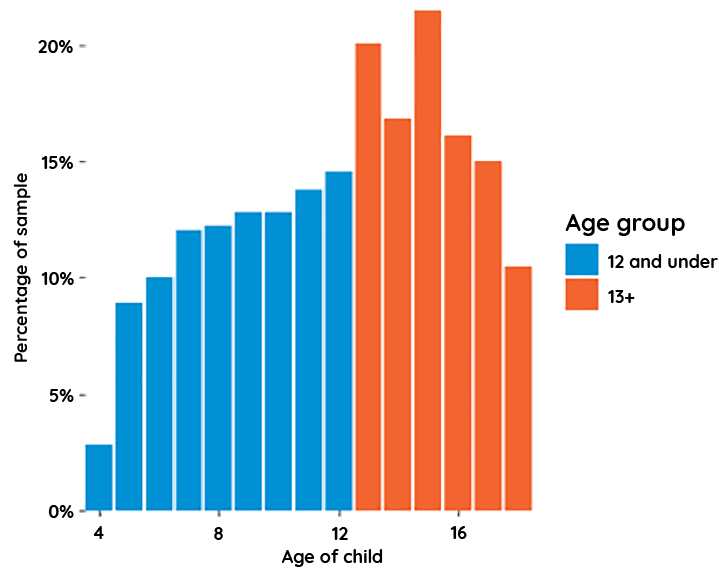
Our research is based on the first wave of Understanding Society’s Covid survey, conducted over 5 days at the end of April. It includes a module on homeschooling, asked of all children who would usually be attending school at this time. The sample consists of 4559 school-aged children. Children who are not yet in school or have left school are not included in this, and it is therefore not a representative sample of all children, just school-attending children. We have broken down our analysis by teenagers (13 and over) and young children (12 and under).
The overwhelming majority of children (96%) were not attending school at the time of the interview (around the end of April). For those who were attending, the most common reason was being a child of key workers. It was much more common for the children of key workers to attend school when those children were younger, likely due to the fact that older children can more safely be left at home alone.
| Did the child attend school in person? | 12 & under | 13+ |
|---|---|---|
| No | 94.9% | 97.8% |
| Yes (Vulnerable or requires specialist support) | 1.2% | 1.2% |
| Yes (Attends residential special school or boarding school) | 0.4% | 0.5% |
| Yes (Parents are key workers) | 3.6% | 0.5% |
Sample: All children who would usually be attending school
While the fact of being home from school was almost universal, the experience of it differed dramatically from child to child. Of those who are not at school, the majority have been provided schoolwork. However, a large number of teenagers (roughly 1 in 5) have not been provided with any work.
| Does school provide work for the child? | 12 & under | 13+ |
|---|---|---|
| Yes | 95.7% | 81.5% |
| No | 4.3% | 18.5% |
Sample: All children who would usually be attending school, but are not
For the children who have been provided with work, there are big differences in the level of work provided. The two figures below show the range in terms of online and offline lessons provided to children per day. In general, the teenagers who are receiving work are receiving more of it than young children, but there are many with a small number of offline lessons per day.
| Number of offline lessons provided | 12 & under | 13+ |
|---|---|---|
| None | 6.9% | 9.4% |
| Less than one a day | 9.6% | 12.8% |
| About 1 a day | 19.5% | 15.6% |
| About 2 a day | 20.3% | 18.4% |
| About 3 a day | 22.7% | 20.1% |
| About 4 or more a day | 21% | 23.6% |
Sample: Children who are not attending school who have had work sent home
Online lessons are less common but there are nonetheless children receiving 4 or more per day.
| Number of online lessons provided | 12 & under | 13+ |
|---|---|---|
| None | 58.1% | 49.8% |
| Less than one a day | 11.7% | 15.8% |
| About 1 a day | 11.7% | 10.1% |
| About 2 a day | 7.8% | 8.1% |
| About 3 a day | 4.6% | 7.7% |
| About 4 or more a day | 6.2% | 8.5% |
Sample: Children who are not attending school who have had work sent home
Once again, the inconsistency in remote school experience is seen in the proportion of children who are having their work marked by teachers. Some are getting nothing marked, some are getting everything marked and some have no work that is expected to be assessed (even though they have some work to do).
| How much of the childs homework is marked | 12 & under | 13+ |
|---|---|---|
| None of it | 22.3% | 8.1% |
| Less than half | 11.4% | 12.8% |
| Half or more | 15% | 21.1% |
| All of it | 33.7% | 43.3% |
| Not applicable, not required to return work | 17.6% | 14.6% |
Sample: Children who are not attending school who have had work sent home
The most common amount of time to spend on schoolwork per day is 1 to 2 hours for young children and 2 to 3 hours for teenagers, a substantial reduction from the 5+ hours children would be spending at school per day. However the distribution of time is quite widely spread. At least 1 in 10 teenagers is spending more than 5 hours per day on school work while just under 1 in 10 is spending less than an hour a day.
| Hours spent on schoolwork per day | 12 & under | 13+ |
|---|---|---|
| less than an hour | 11.1% | 8.9% |
| 1 to 2 hours | 27.8% | 19.7% |
| 2 to 3 hours | 25.7% | 22.1% |
| 3 to 4 hours | 19.8% | 20.4% |
| 4 to 5 hours | 10% | 15.1% |
| 5 or more hours | 4.9% | 11.4% |
| Does not apply | 0.7% | 2.4% |
Sample: Children who are not attending school who have had work sent home
Of the children who are being given schoolwork, there are big variations in the amount of help they are receiving from parents. The majority of older children are receiving none or less than an hour of help per day. While this level of help is potentially higher than they might usually receive (due to parents being furloughed or working from home), it’s not clear that it would make up for lost in-person teacher support.
| Hours spent helping with schoolwork per day | 12 & under | 13+ |
|---|---|---|
| None | 2.8% | 28.6% |
| less than an hour | 23.6% | 43.1% |
| 1 to 2 hours | 34% | 17.8% |
| 2 to 3 hours | 21.4% | 6.2% |
| 3 to 4 hours | 10.2% | 1% |
| 4 to 5 hours | 6% | 0.8% |
| 5 or more hours | 1.9% | 0.3% |
| Does not apply | 0.1% | 2.1% |
Sample: Children who are not attending school who have had work sent home
Older children overwhelmingly need a computer or laptop for most or all of their work.
| How much of the school work requires a computer? | 12 & under | 13+ |
|---|---|---|
| None of it | 8.6% | 0.4% |
| Less than half | 22% | 4.1% |
| Half or more | 31.6% | 24.8% |
| All of it | 36% | 68.6% |
| Not applicable | 1.9% | 2% |
Sample: Children who are not attending school who have had work sent home
This answer has potential to be an underestimate. In the interests of speed, the USoc questionnaire was rapidly rolled out online where they would usually supplement with follow-up paper and telephone interviews. Nonetheless, there are still a meaningful number of children without a computer and a high number with only a shared device.
| Does the child have a computer | 12 & under | 13+ |
|---|---|---|
| Yes, childs own | 36.6% | 60.9% |
| Yes, shared | 58.8% | 36% |
| No | 4.6% | 3.2% |
Sample: Children who are not attending school who have had work sent home
Most children have made use of some additional resources for education but only a small number have accessed paid tutoring/resources.
| Does the child use additional resources including tutoring | 12 & under | 13+ |
|---|---|---|
| Yes, we use freely available resources | 62.6% | 45% |
| Yes, we pay for additional resources | 8.8% | 5.9% |
| No | 32.3% | 51% |
Sample: Children who would usually be attending school (including those currently attending)
A minority of children are eligible for free school meals (FSM). It is more common among younger children.
| Did the child receive FSM in January or February | 12 & under | 13+ |
|---|---|---|
| Yes | 26.4% | 10.1% |
| No | 73.6% | 89.9% |
Sample: Children who would usually be attending school (including those currently attending)
Of the children who received free school meals in January or February, many were still not receiving food or vouchers in April.
| Are you now receiving vouchers or meals provided by the school | 12 & under | 13+ |
|---|---|---|
| School is providing free meals | 9.2% | 5.3% |
| Receiving vouchers | 31.5% | 75.5% |
| No | 59.4% | 19.2% |
Sample: Children who received a free school meal in January or February