At Prime Minister’s Questions (PMQs) on 17 June, there was disagreement between the Leader of the Opposition, Keir Starmer, and the Prime Minister, Boris Johnson, on trends in the level of child poverty. The exchange (edited for clarity) was as follows:
Keir Starmer –
“A report last week from the Government’s Social Mobility Commission concluded that there are now ‘600,000 more children…living in relative poverty’ than in 2012. The report went on to say: ‘Child poverty rates are projected to increase to 5.2 million by 2022.’
What does the Prime Minister think caused that?”
Boris Johnson –
“[…] But I must say that I think he is completely wrong in what he says about poverty. Absolutely [sic] poverty and relative poverty have both declined under this Government and there are hundreds of thousands—I think 400,000—fewer families living in poverty now than there were in 2010.”
This blog will assess the following claims:
- An additional 600,000 children are now living in relative poverty compared with 2012. [Keir Starmer]
- The total number of children in poverty is projected to rise to 5.2 million by 2022. [Keir Starmer]
- Absolute poverty and relative poverty have both declined under this Government. [Boris Johnson]
- There are 400,000 fewer families living in poverty now than there were in 2010. [Boris Johnson]
Background
A child is living in poverty if they live in a household whose income falls below a given threshold. In the UK, there are two definitions of that threshold:
- The threshold for relative poverty is set at 60% of the average (median) net household income* in the year in the year in question. This threshold can fluctuate from one year to the next.
- The threshold for absolute poverty is set at 60% of the average (median) net household income in 2010/11. This threshold does not fluctuate over time.
These thresholds can be considered both before taking into account housing costs (BHC) and after housing costs (AHC). This therefore results in four different measures of child poverty each year.
The Social Mobility Commission (SMC) is a non-departmental public body focused on the issue of social mobility. It recently published a report, to which Keir Starmer referred at PMQs, that monitored the government’s progress on a range of social mobility indicators and made some recommendations for improvement.
Claim 1: An additional 600,000 children are now living in relative poverty compared with 2012
Keir Starmer sourced this claim to “the Government’s Social Mobility Commission”. The recent report from the SMC states:
Whilst relative child poverty rates have remained stable over recent years, there are now 4.2 million children living in poverty – 600,000 more than in 2011/12.
To evidence this statement, the SMC cites another government publication, the Households Below Average Income (HBAI) statistical release produced annually by the Department for Work and Pensions. This is the official government data on household incomes and poverty levels.
It is assumed that the word “now” in the SMC report refers to the most recent HBAI figures, which cover the financial year ending March 2019. These figures show that relative child poverty did indeed increase by 600,000 between 2011/12 and 2018/19 – from 3.6 million (in 2011/12) to 4.2 million (in 2018/19).
Verdict: This claim is true, if judged against official statistics. The government’s own figures show that relative child poverty increased by 600,000 between 2011/12 and 2018/19.
Claim 2: The total number of children in poverty is projected to rise to 5.2 million by 2022
This claim was also attributed to the SMC report, which states that:
Child poverty rates are projected to increase to 5.2 million by 2022.
Keir Starmer was correct in his description of what the SMC report said. Whether the underlying projection is correct is more difficult to establish because it is a forecast: a statement about something that has not yet happened.
The report cites a 2017 study from the independent Institute for Fiscal Studies (IFS) that forecasted household incomes and living standards up to 2022. The report used the IFS’s tax and benefit simulation model, along with some assumptions about how the economy might evolve between 2017 and 2022, in order to forecast a future trajectory of child poverty rates.
We have not been able to locate the exact figure of 5.2 million in the IFS report, but it is broadly consistent with the following graph (taken from the report). If 5.2 million children were in relative poverty that would equate to a rate of 37%, roughly in line with what is visible in the graph.
Relative poverty rates based on incomes after housing costs
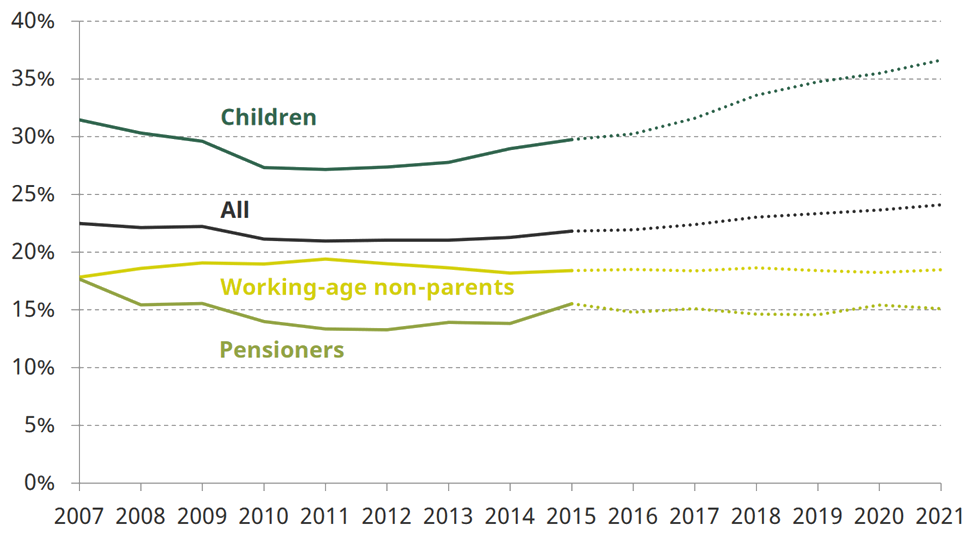
Source: Figure 2.3, IFS, Living standards, poverty and inequality in the UK: 2017-18 to 2021-22.
The IFS forecast is based on a number of assumptions, meaning its conclusions are open to debate. However, a 2019 report from the Resolution Foundation reached an almost identical conclusion, projecting an additional 5.2 million children in relative poverty by 2023/24.
These forecasts are now out of date because they were carried out before the Covid-19 crisis hit the economy. Whether Covid-19 will push more families into poverty is not yet known for certain**, but a recent report from the Institute for Public Policy Research (IPPR) suggested that it has led to an additional 200,000 children in relative poverty.
Verdict: This claim is an accurate description of what the SMC report said, which in turn appears to be based on a published forecast from the independent Institute for Fiscal Studies. It remains to be seen whether this forecast will materialise, and the forecast is now out of date because of Covid-19. But this caveat is not sufficient to disprove the claim: if there is reason to believe that the Covid-19 crisis will worsen poverty rates, then that would make this claim more likely to be optimistic rather than pessimistic.
Claim 3: Absolute poverty and relative poverty have both declined under this government
At face value, this statement is not specific enough to be verified, because it could have many potential interpretations:
- “Absolute and relative poverty” could refer to the poverty rate before or after housing costs, across all individuals in the population. But it could also refer to absolute and relative child poverty, since that was the context of the debate.
- “Declined under this government” could mean a decline between 2010 until the most recently available figures, or it could mean a decline over some period in between.
As with child poverty, the official statistics for poverty rates across all individuals are published in DWP’s HBAI statistical release.
The table below shows the changes in poverty rates under a number of different interpretations of the Prime Minister’s claim. Each cell shows the change in the number of people (children or individuals) in poverty in millions between the baseline year and the most recent release. For example, there were 1.2 million more people in relative poverty before housing costs in 2018/19 compared to 2010/11, and 100,000 fewer in absolute poverty over the same time period.
Change in poverty under the Conservative Government (millions).
| 2010/11 – 2015/16 | 2015/16 – 2018/19 | 2010/11 – 2018/19 | 2009/10 – 2018/19 | |||||
|---|---|---|---|---|---|---|---|---|
| Relative | Absolute | Relative | Absolute | Relative | Absolute | Relative | Absolute | |
| Children (BHC) | +0.4 | 0 | +0.1 | +0.1 | +0.5 | +0.1 | +0.2 | -0.1 |
| Individuals (BHC) | +0.6 | -0.5 | +0.6 | +0.4 | +1.2 | -0.1 | +0.6 | -0.2 |
| Children (AHC) | +0.4 | +0.1 | +0.2 | 0 | +0.6 | +0.1 | +0.3 | -0.1 |
| Individuals (AHC) | +1.0 | -0.2 | +0.5 | +0.1 | +1.5 | -0.1 | +0.9 | -0.2 |
CCO analysis of DWP.
Note: BHC and AHC refer to before and after housing costs respectively.
Under none of the scenarios considered in this table has there been a reduction in both relative and absolute poverty.
There are occasions where specific measures of both absolute and relative poverty have fallen over a single year. For example, between 2017/18 and 2018/19 the number of children in relative poverty before housing costs (BHC) fell from 3 million to 2.8 million, while the number of children in absolute poverty before housing costs (BHC) fell from 2.5 million to 2.4 million.
This would, however, be a very selective reading of the data. Firstly, this was a small reduction in poverty levels within the context of the wider trend of larger increases in poverty levels. Secondly, at the same time the number of children in relative poverty after housing costs (AHC) actually rose, while the number of children in absolute poverty AHC stayed the same.
It is also possible that the Prime Minister was referring to an alternative measure of poverty or child poverty which has in fact fallen, but this context was not provided or suggested in his answer.
An alternative poverty measure produced by the Social Metrics Commission does show reductions in poverty for some population groups between 2010/11 and 2017/18. However that data would not actually speak to this particular claim. The claim specifically mentioned “absolute poverty and relative poverty”; the Social Metrics Commission data does not measure either of these.
Verdict: Mostly false. It is possible to identify certain points since 2010, and certain definitions of the poverty measure, that show a fall in both absolute and relative poverty. However, this is not the general pattern. The claim is only consistent with a selective and unrepresentative reading of the overall record on both of these measures. The Prime Minister may have access to other data that better substantiates this claim, but it is not borne out by the government’s own published figures on absolute and relative poverty.
Claim 4: There are 400,000 fewer families living in poverty now than there were in 2010
This claim did not have an accompanying source and has been difficult to verify from existing published reports. While there are no perfectly comparable figures in the official government data, the HBAI release does contain breakdowns of individual poverty by family type, including for couples with children or single parents.
However, among these two groups combined, levels of relative poverty actually increased between 2010/11 and 2018/19. Our calculations using the HBAI figures suggest that an additional 800,000 people in families (defined as couples with children, or single parents) were living in relative poverty AHC in 2018/19 compared to 2010/11 (an increase from 6.8 million to 7.6 million). Meanwhile the number in absolute poverty AHC fell by 100,000 over the same period (from 4.4 million to 4.3 million). Before housing costs, relative poverty rose by 500,000 over this period for this group, while absolute poverty was broadly unchanged.
None of these estimates can support the Prime Minister’s claim of 400,000 fewer families being poverty. As with the previous claim, it is possible that the Prime Minister was referring to alternative evidence rather than the official poverty statistics, but this has not yet been confirmed or provided.
An alternative poverty measure produced by the Social Metrics Commission suggests that the level of poverty among individuals who were in families was 20,000 higher in 2017/18 than in 2010/11, and 290,000 lower in 2017/18 than in 2009/10. However, this is a number of individuals – not a number of families.
It also is worth noting that the organisation Full Fact has also struggled to establish the evidence for this claim.
Verdict: Appears to be false. While there is no exact reference for this claim, it is not consistent with the official statistics. The Prime Minister may have access to other data that substantiates this claim, but it is not borne out by the government’s own published figures.
Overall verdict
The two claims made by Keir Starmer were correct descriptions of findings contained in the SMC report. The first of these claims is based on the government’s own figures. The second claim is based on a forecast produced by the IFS – which, while not an official estimate, was the best available estimate at the time (and subsequently corroborated by research by the Resolution Foundation). This forecast was produced before Covid-19 and is now out of date given how Covid-19 has affected family incomes, but that means the forecast is more likely to prove optimistic than pessimistic.
The two rebuttals offered by the Prime Minister are not borne out by the government’s own figures. He may have been referring to other data, such as the poverty measure produced by the Social Metrics Commission, but this would not appear to properly substantiate his claims either.
What do we know about the current level of child poverty?
The official child poverty statistics for this period will not be available until 2022. The next release of these statistics, due to be published nine months from now, will only cover the year to 31 March 2020 – in other words, up to the beginning of Covid-19 lockdown.
What we know now about the current level of child poverty is therefore limited. We know that many families have seen a loss of income as a result of Covid-19. Based on a nationally representative household survey taken at the end of April, we have estimated that 88,000 children had seen a parent lose their jobs, 1.2 million children were in families where a parent had been furloughed, and 2 million children were in families where a parent’s working hours had been reduced. This means that well over 3 million children were in households where between 20% of earnings (the furlough rate) and 47% of earnings (the mean Universal Credit replacement rate) had been lost. Some of these children will have been living in poverty already, but it is not clear how many.
Furthermore, as mentioned above, a recent report by IPPR has attempted to predict what has happened to child poverty as a result of Covid-19. It suggests that the total number of children now living in relative poverty is 4.5 million – an increase of 200,000 compared to 2018/19.
* Net household income means after taking into account taxes paid and benefits received
** While the falls in income caused by Covid-19 would naturally be expected to increase levels of absolute poverty, their effect on the level of relative poverty may be more complex, and will depend on how the entire distribution of income has been affected
